
Survey Results
Employee and Commuter Student Mode Splits (2001-2019)
The type of transportation people use to travel is known as a mode. A ‘mode split’ comprises the total picture of all the different transportation types people use to travel. Tracking and studying a mode split is an essential component in developing sustainable transportation options in our region. The UNC-Chapel Hill mode split results aid staff to determine the effectiveness of transportation options and incentive programs.
The charts below show the method University employees and students used to travel to campus:
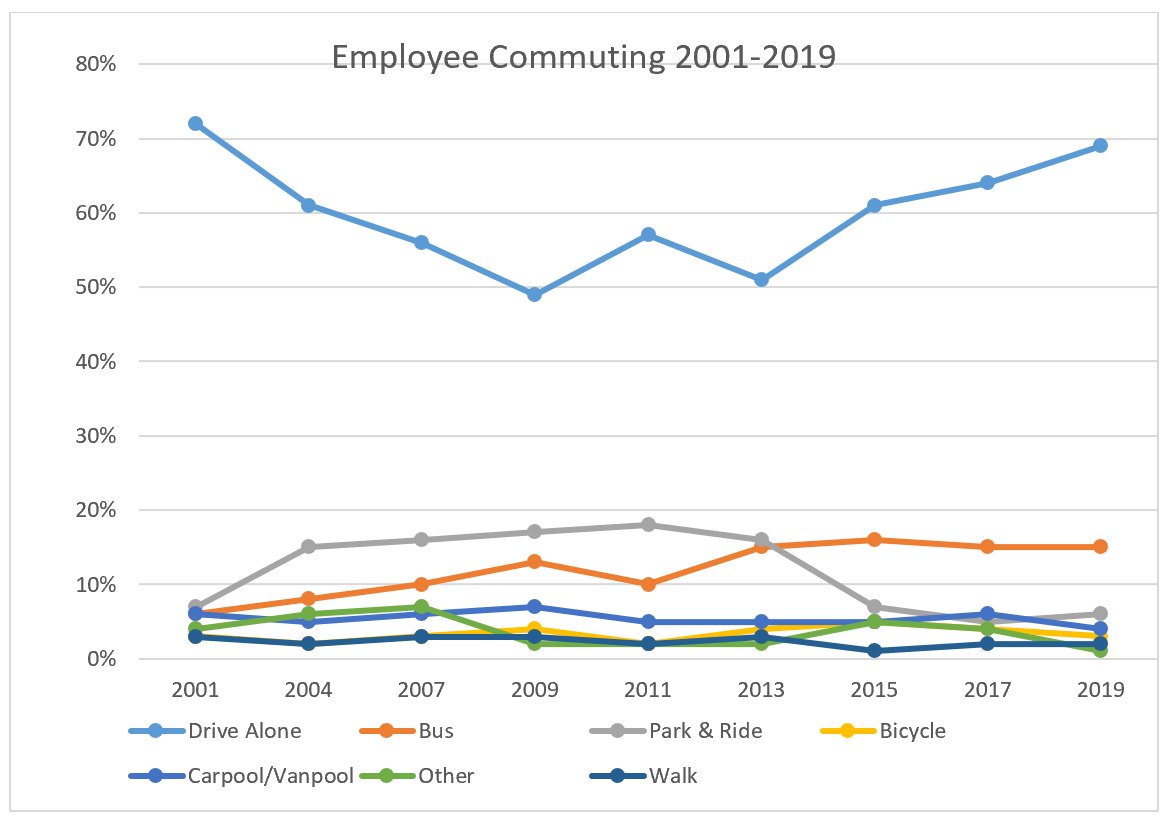
*The 2019 Survey split bus results into Local Bus- Chapel Hill Transit (8%) and Regional Bus (7%).
*’Other’ category includes telework, dropped off, and motorcycle/scooter.
| Commute Method | 2007 | 2009 | 2011 | 2013 | 2015 | 2017 | 2019 |
|---|---|---|---|---|---|---|---|
| Drive Alone | 0.56 | 0.49 | 0.57 | 0.51 | 0.61 | 0.64 | 0.69 |
| Bus | 0.10 | 0.13 | 0.10 | 0.15 | 0.16 | 0.15 | 0.15 |
| Park & Ride | 0.16 | 0.17 | 0.18 | 0.16 | 0.07 | 0.05 | 0.06 |
| Bicycle | 0.03 | 0.04 | 0.02 | 0.04 | 0.05 | 0.04 | 0.03 |
| Carpool/Vanpool | 0.06 | 0.07 | 0.05 | 0.05 | 0.05 | 0.06 | 0.04 |
| Other | 0.07 | 0.02 | 0.02 | 0.02 | 0.05 | 0.04 | 0.01 |
| Walk | 0.03 | 0.03 | 0.02 | 0.03 | 0.01 | 0.02 | 0.02 |
Employee Mode Split
- The percentage of employees who drive alone to campus increased to 69%, the highest level since 2001 (72%). This may be associated with the expansion of the Craige Parking Deck in 2017 and low fuel prices.
- Bicycling declined to 3%, the lowest level since 2011. Cycling infrastructure connecting Chapel Hill to campus and incentives to promote cycling has not been upgraded for many years.
- Bus ridership remains consistent, likely due to former Park-and-Ride users maintaining their previous shift to transit.
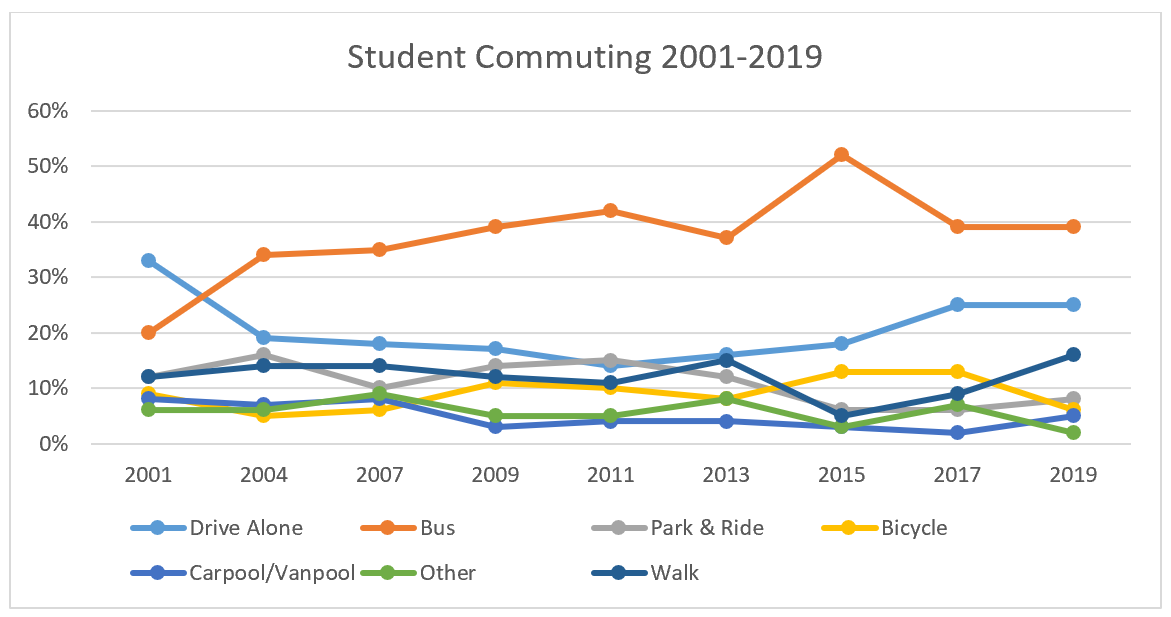
*The 2019 Survey split Bus into Local Transit-Chapel Hill Transit (35%) and Regional Bus (4%).
| Commute Method | 2007 | 2009 | 2011 | 2013 | 2015 | 2017 | 2019 |
|---|---|---|---|---|---|---|---|
| Drive Alone | 0.18 | 0.17 | 0.14 | 0.16 | 0.18 | 0.25 | 0.25 |
| Bus | 0.35 | 0.39 | 0.42 | 0.37 | 0.52 | 0.39 | 0.39 |
| Park & Ride | 0.10 | 0.14 | 0.15 | 0.12 | 0.06 | 0.06 | 0.08 |
| Bicycle | 0.06 | 0.11 | 0.10 | 0.08 | 0.13 | 0.13 | 0.06 |
| Carpool/Vanpool | 0.08 | 0.03 | 0.04 | 0.04 | 0.03 | 0.02 | 0.05 |
| Other | 0.09 | 0.05 | 0.05 | 0.08 | 0.03 | 0.05 | 0.02 |
| Walk | 0.14 | 0.14 | 0.12 | 0.11 | 0.15 | 0.05 | 0.16 |
Commuter Student Mode Split
- Reported bus usage remained constant at 39%. Local Chapel Hill Transit (35%) and Regional bus (4%) usage were separated for the first time in the 2015 Survey. In 2017, Chapel Hill Transit usage decreased to 35% and Regional Transit decreased to 4%.
- Bicycle usage decreased significantly from 13% to 6%.
- Park-and-Ride increased from 6% to 8% and walking increased from 5% to 16%. These increases are likely due to the increase in walkable and transit accessible off campus housing.
Other Survey Data Highlights
In order to effectively promote use of modes of transportation other than driving it is important to understand commuter preferences and behaviors and the factors that influence their travel choices. These sections highlight data from the survey that will help develop programs and policies to enhance mobility to campus.
Employees provided common reasons why they do not ride the bus or carpool/vanpool more often. The most common reason reported was the bus trip takes too long compared to driving, irregular work schedules, and the bus stop is too far from my home/workplace.
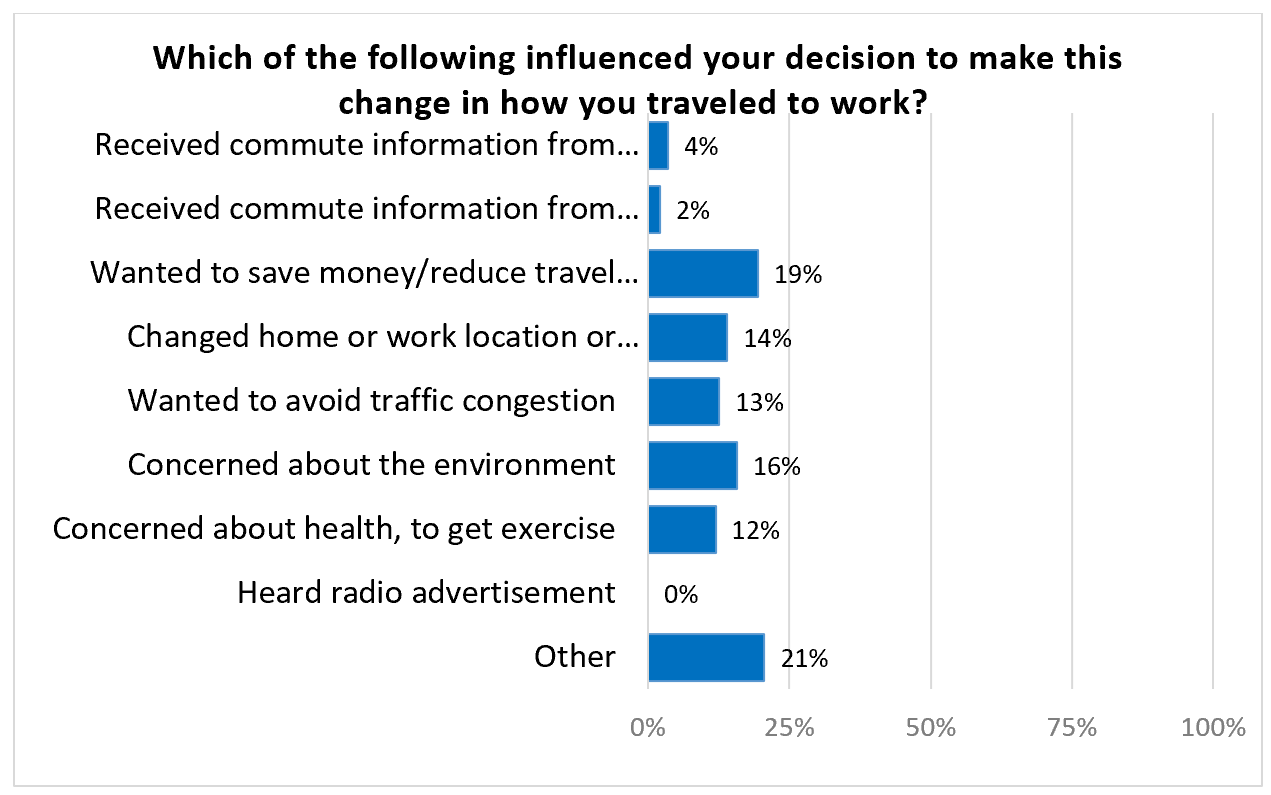
Employees who made changes to how they get to work chose to ride a bus or telework because they wanted to save money/reduce travel costs, were concerned about the environment, and changed their home/work location or work hours.
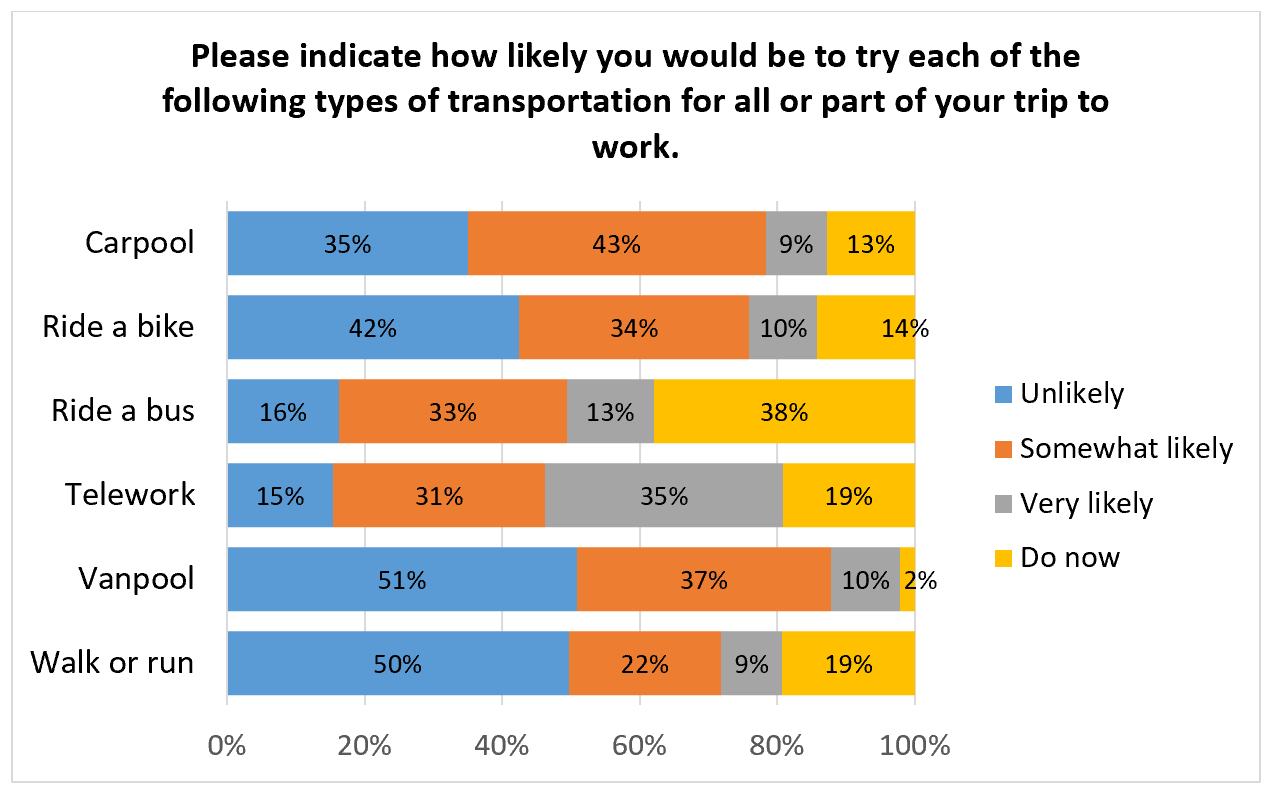
Riding the bus and teleworking are also the modes that employees are most likely to try in the future:
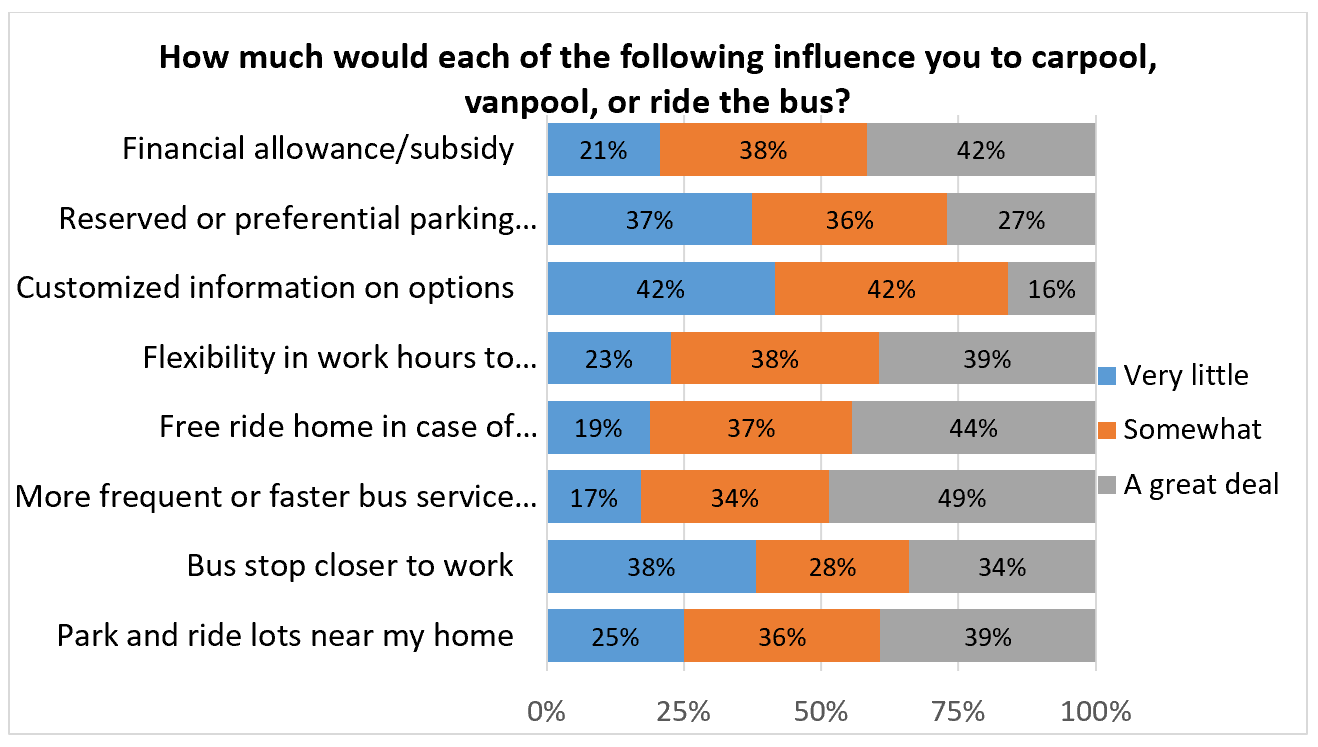
The largest influence to carpool, vanpool, or bus usage is more frequent or faster bus service to work, a free ride in case of emergencies, and flexibility in work hours to accommodate schedules.
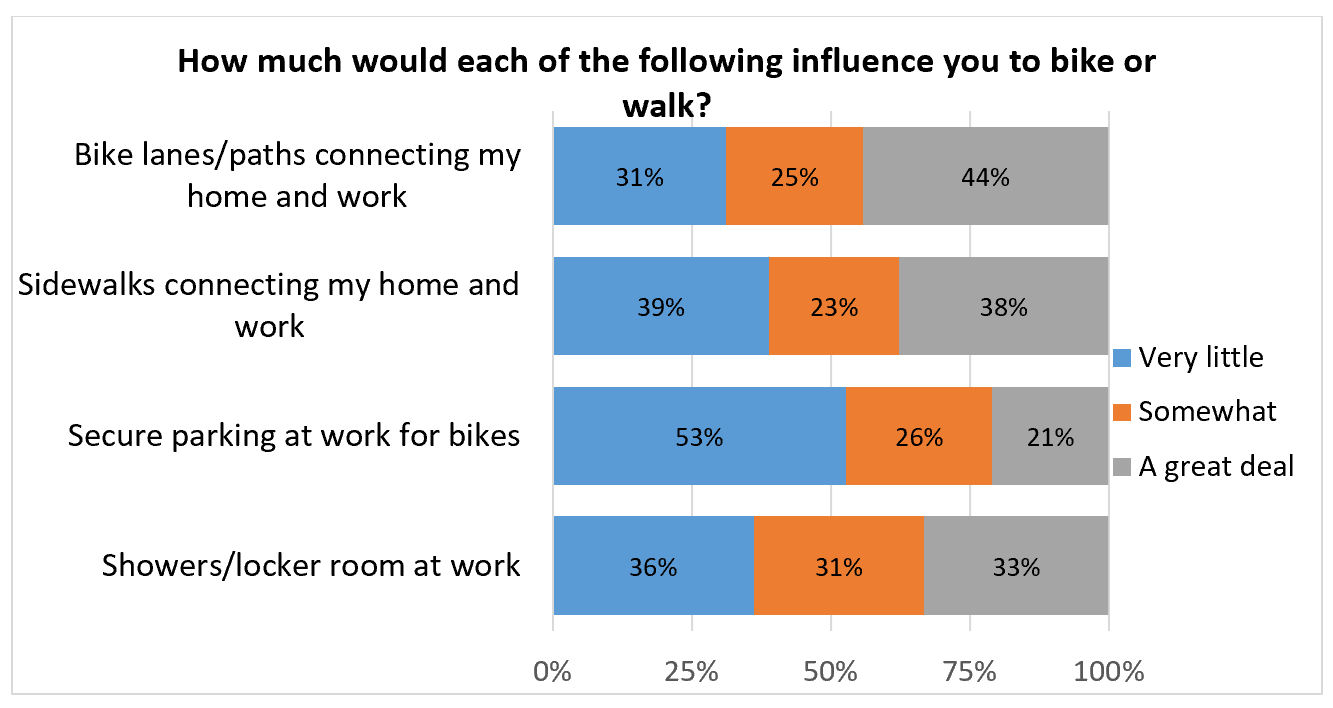
The top influencers on people biking and walking more included more bike lanes/paths and sidewalks connecting their home to workplace. This shows how important local land use policy plays in providing housing within a walkable and bikeable distance as well as the importance of connecting neighborhoods to campus with safe walking and biking facilities.
Students cited irregular schedules, the bus taking too long compared to a car, and the bus running too infrequently near their home. The majority of off campus student housing is within a .25 mile of a Chapel Hill Transit bus stop which points to the need for increased frequency to accommodate irregular schedules. Chapel Hill Transit’s North-South Corridor Bus Rapid Transit (BRT) project consists of a BRT system along the Martin Luther King Jr Boulevard/South Columbia Street corridor that will open in approximately 2023. A congestion-free bus option may alleviate these concerns by providing fast, frequent, reliable service to campus.
Employees and students who drive alone travel similar distances as those who ride a regional bus, park and ride, or get dropped off/ride-hail:
| Primary Commute Mode | Employee | Student |
|---|---|---|
| Drive Alone | 16.7 | 16.3 |
| Bicycle | 4.2 | 2.0 |
| Carpool/Vanpool | N/A | 4.9 |
| Carpool | 16.3 | N/A |
| Vanpool | 23.7 | N/A |
| Dropped off/Ride-hailing service (taxi, Uber, Lyft, etc.) | 15.2 | 3.0 |
| Walk/Run (the entire trip) | 1.8 | 1.0 |
| Chapel Hill Transit Bus | 6.1 | 2.9 |
| Regional Bus (GoTriangle, PART) | 18.5 | 15.6 |
| Park-and-Ride served by Chapel Hill Transit | 15.9 | 11.5 |
| Motorcycle/Moped | 10.2 | 7.1 |
| Scooter | N/A | 1.0 |
| None – Most or all classes are online | N/A | 11.5 |
| Telework | 40.3 | N/A |
Employees are most likely to try teleworking at a rate of 35%, three times as many people as the second mode, the bus (13%).
The top four reasons employees living less than five miles from campus gave for not bicycling more to campus include: Too far to bike, the roads to campus are unsafe, lack of bike lanes or paths on route, and there is no place to shower at work. Students indicated that it is too far to bike, the route to campus is too hilly/biking is too difficult, roads to campus are unsafe, and there is a lack of bike lanes/separated paths on their route.
Dedicating more transportation funding to bicycle improvements may alleviate concerns about unsafe road conditions by separating people from high speed motor vehicle traffic. The increased affordability and usage of electric assist bicycles may alleviate those who think cycling is too difficult. Twenty percent of employees who stop on the way to work do so to drop off and pick up children. Increasing the connectivity and safety of cycling infrastructure coupled with flexible schedules may facilitate those parents to ride with or take their children to school by bicycle.