
Development Plan Transportation Changes
- Existing conditions (the traffic levels in 2017);
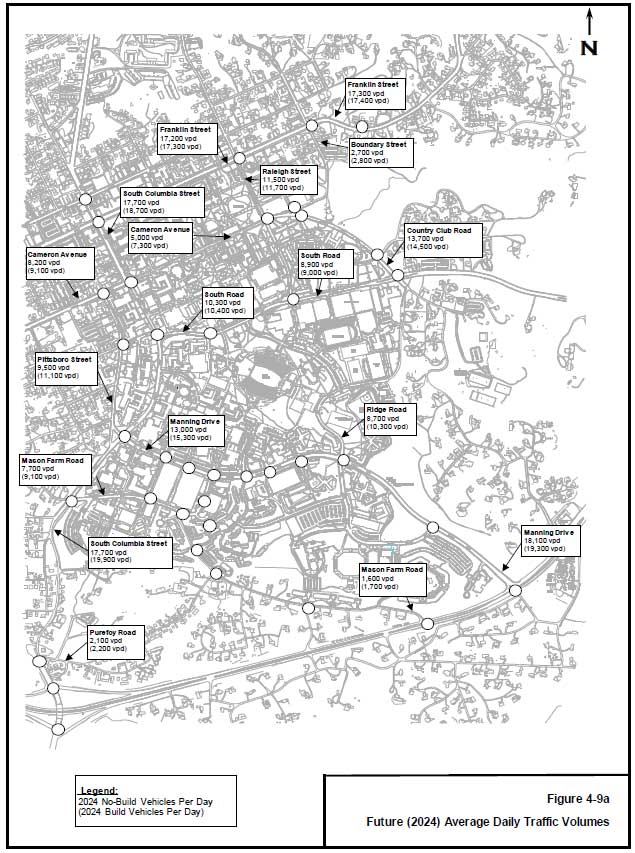
- No-Build conditions (the forecast conditions in 2024 if the Development Plan projects did not exist); and
- Build conditions (the forecast conditions in 2024 including the effects of the Development Plan projects).
The existing conditions were measured using traffic counts collected in fall 2017 on days when the University was in session. Because similar analyses were undertaken in 2001, 2003, 2005, 2007, 2009, 2011, 2013, and 2015, changes in traffic levels can be tracked. The No-Build conditions are forecast by applying annual growth rates to the existing traffic levels. The Build conditions are forecast by taking the No-Build traffic levels and adding the trips due to Development Plan projects. These trips are estimated from the forecast parking changes (described above), using known trip rates per parking space.
Traffic volumes have generally remained stable, or, in some cases, decreased, since the 2007 counts. Possible reasons include the ongoing development and implementation of the University’s Transportation Demand Management (TDM) program, including full subsidy of regional transit ridership on GoTriangle and PART as well as improvements to the bicycling infrastructure in the Town and on campus.
In the No-Build scenario, background traffic growth is expected to produce increased volumes. This is normal for growing areas such as Chapel Hill.
In the Build scenario, the further increase in traffic along most campus roads is expected to be minimal, although some intersections near proposed parking facilities will see specific turning movements increase noticeably. In some areas where parking is being eliminated, some turning movements will decrease compared to the No-Build scenario. The largest increase in traffic volumes will be on Manning Drive.
| Link # | Roadway | 2001 ADT | 2003 ADT | 2005 ADT | 2006 ADT | 2007 ADT | 2009 ADT | 2011 ADT | 2013 ADT | 2015 ADT | 2017 ADT | 2017-2024 Annual Growth Rate | Projected 2024 No-Build ADT | Projected 2024 Build ADT |
|---|---|---|---|---|---|---|---|---|---|---|---|---|---|---|
| 1 | S. Columbia St. (south of Franklin St.) | 20,720 | 19,060 | 17,530 | – | 17,530 | 15,410 | 14,380 | 14,663 | 16,329 | 15,783 | 1.7% | 17,700 | 18,700 |
| 2 | Raleigh St. (south of Franklin St.) | 14,470 | 10,710 | 13,080 | 13,080 | 11,020 | 11,710 | 9,910 | 10,514 | 10,450 | 11,031 | 0.6% | 11,500 | 11,700 |
| 3 | Cameron Ave. (west of Pittsboro St.) | 9,820 | 8,300 | 8,510 | – | 7,630 | 9,260 | 7,220 | 6,693 | 7,558 | 7,710 | 0.9% | 8,200 | 9,100 |
| 4 | Cameron Ave. (east of S. Columbia St.) | 9,070 | 8,330 | 6,430 | 6,430 | 5,270 | 5,540 | 5,910 | 4,679 | 4,881 | 4,616 | 1.2% | 5,000 | 7,300 |
| 5 | Country Club Rd. (north of South Rd.) | 13,470 | 14,080 | 12,200 | 12,200 | 12,990 | 11,960 | 11,260 | 10,726 | 12,534 | 13,060 | 0.7% | 13,700 | 14,500 |
| 6 | South Rd. (east of Columbia St.) | 10,460 | 8,840 | 11,400 | – | 8,400 | 7,430 | 8,370 | 8,593 | 9,649 | 9,209 | 1.7% | 10,300 | 10,400 |
| 7 | South Rd. (east of Raleigh St.) | 9,840 | 10,000 | 12,890 | 12,890 | 7,500 | 7,510 | 7,730 | 7,944 | 7,744 | 7,802 | 2.0% | 8,900 | 9,000 |
| 8 | Pittsboro St. (south of McCauley St.) | 10,960 | 10,070 | 10,920 | – | 9,550 | 9,750 | 8,810 | 8,061 | 8,487 | 8,632 | 1.4% | 9,500 | 11,100 |
| 9 | Manning Dr. (east of Columbia St.) | 14,100 | 13,220 | 12,480 | 12,480 | 11,070 | 11,060 | 10,020 | 10,713 | 11,298 | 11,828 | 1.4% | 13,000 | 15,300 |
| 10 | Ridge Rd. (north of Manning Dr.) | 8,320 | 7,870 | 7,300 | 7,300 | 7,910 | 8,730 | 8,110 | 7,819 | 7,216 | 7,594 | 2.0% | 8,700 | 10,300 |
| 11 | S. Columbia St. (south of Mason Farm Rd.) | 18,470 | 18,250 | 16,190 | – | 16,090 | 15,430 | 14,760 | 13,982 | 15,480 | 16,285 | 1.3% | 17,700 | 19,900 |
| 12 | Manning Dr. (east of Ridge Rd.) | 17,260 | 14,680 | 17,880 | 17,880 | 15,680 | 16,150 | 14,660 | 15,734 | 15,879 | 17,023 | 0.9% | 18,100 | 19,300 |
| 13 | Franklin St. (west of Raleigh St.) | 17,000 | 19,260 | 18,850 | – | 19,320 | 16,250 | 14,370 | 14,605 | 14,895 | 16,228 | 0.9% | 17,200 | 17,300 |
| 14 | Franklin St. (east of Boundary St.) | – | 23,560 | 20,190 | 20,190 | 24,730 | 17,390 | 16,770 | 16,614 | 16,620 | 16,327 | 0.9% | 17,300 | 17,400 |
| 15 | Boundary St. (south of Franklin St.) | – | 3,230 | 2,320 | 2,320 | 2,140 | 2,230 | 2,400 | 2,225 | 2,008 | 2,581 | 0.6% | 2,700 | 2,800 |
| 16 | Mason Farm Rd. (east of S. Columbia St.) | 7,700 | 8,230 | 3,400 | 3,400 | 8,390 | 7,330 | 6,910 | 6,314 | 6,755 | 6,746 | 2.0% | 7,700 | 9,100 |
| 17 | Mason Farm Rd. (north of Fordham Blvd.) | 1,360 | 770 | 1,830 | – | 1,820 | 1,770 | 1,730 | 1,720 | 1,546 | 1,596 | 0.4% | 1,600 | 1,700 |
| 18 | Purefoy Rd. (east of Columbia St.)* | 970 | 970 | 1,130 | – | 1,360 | 1,450 | 2,070 | 1,705 | 1,747 | 2,044 | 0.4% | 2,100 | 2,200 |
| 19 | US 15-501 (west of Main St.) | – | – | – | – | 17,840 | 17,080 | 16,770 | 19,993 | 20,801 | 22,587 | 2.0% | 25,800 | 26,400 |
| 20 | US 15-501 (east of Culbreth Rd.) | 30,480 | – | 30,000 | – | 30,310 | 30,570 | 28,390 | 31,867 | 35,429 | 38,238 | 2.0% | 43,600 | 44,800 |
| 21 | NC 54 (west of Hamilton Rd.) | 45,400 | – | 44,000 | – | 47,940 | 43,470 | 41,230 | 41,388 | 48,286 | 51,099 | 2.0% | 58,300 | 60,800 |
| 22 | NC 54 (east of East Barbee Chapel Hill Rd.) | – | – | – | – | 32,100 | 37,390 | 36,320 | 39,967 | 44,174 | 46,875 | 2.0% | 53,400 | 55,600 |
Source: Table 4-9 of Development Plan TIA, December 2017


| Level of Service | Description Delay at a Signalized Intersection | Delay at an Unsignalized Intersection |
|---|---|---|
| A Little or no delay | 10 seconds or less | 10 seconds or less |
| B Short traffic delay | 10-20 seconds | 10-15 seconds |
| C Average traffic delay | 20-35 seconds | 15-25 seconds |
| D Long traffic delay | 35-55 seconds | 25-35 seconds |
| E Very long traffic delay | 55-80 seconds | 35-50 seconds |
| F Unacceptable delay | More than 80 seconds | More than 50 seconds |
Table 2.3 summarizes the LOS at each intersection for each scenario. Each cell includes the overall LOS at the intersection and the LOS for the worst-performing approach.
The following sections discuss some of the intersections that are shown to be experiencing long peak period delays or that have been identified by the Town of Chapel Hill and/or the North Carolina Department of Transportation for pedestrian safety concerns.
Manning Drive at Fordham Boulevard
The University has provided new traffic signal timings for this intersection, yet this intersection continues to experience the worst delays and peak period queues of the intersections immediately adjacent to the campus. The University prepared traffic signal plans in coordination with staff of the Town of Chapel Hill and NCDOT to upgrades at this intersection as well as at the adjacent intersection of Old Mason Farm Road at Fordham Boulevard. The proposed upgrades included crosswalk markings, wheelchair ramps, countdown pedestrian signals, pedestrian push-buttons, a new, larger pedestrian refuge island, and warning signs with flashing beacons for approaching drivers on Fordham Boulevard. The intent of these improvements is to provide a safer environment for pedestrians crossing the streets at each intersection. The improvements have been completed.
US 15-501 at Europa Drive/Erwin Road
At the time of data collection for the 2007 TIA Update, the intersection of US 15-501 at Europa Drive/Erwin Road was still operating as a conventional intersection. However, during January 2008, this intersection was converted to a synchronized street (formerly referred to as a superstreet), which, according to the staff of NCDOT, has improved traffic flow on 15-501. The synchronized street section of US 15-501 at Europa Drive and Erwin Road was fully operational when traffic data was collected in the fall of 2013 and is still operating as a synchronized street in 2017.
All of the individual intersections that make up the synchronized street section are operating at LOS C or better.
Although the synchronized street at this location has improved traffic flow in this section of the corridor, a Major Investment Study (MIS) concluded that the size of the problem along 15-501 requires a large-scale integrated multimodal solution.
South Columbia Street at Cameron Avenue
This intersection marks the north end of the South Columbia Street-Pittsboro Street one-way pair. It experiences a high volume of pedestrian and bicycle traffic and results in traffic queues along Cameron Avenue to Raleigh Street and South Columbia Street. The Town and NCDOT coordinated on a project to implement special traffic signal phasing at this intersection which includes a pedestrians-only phase. The intent of the new traffic signal phasing is to provide a safer environment for pedestrians crossing the streets at this intersection. The new phasing for this intersection was in operation during the collection of traffic data for the 2017 update of the development plan traffic impact analysis study.
Some unsignalized intersections are experiencing long delays on the minor approaches. These intersections are discussed below:
Country Club Road at Battle Lane/Boundary Street
This intersection was the subject of a special study during the analysis for Modification No. 1 of the UNC-Chapel Hill Development Plan. An outcome of that study was the implementation of measures to control the movement of pedestrians in the vicinity of this unsignalized intersection. Town staff has indicated that Town may wish to coordinate with the University to revisit the study of this intersection to determine the need for further upgrades. During discussions prior to the 2011 TIA update, staff of the Town expressed a desire to assess if peak period conditions merit additional improvements. Although some movements have experienced increased volume since 2007, no additional improvements are recommended at this time. The University will continue to monitor conditions at this intersection. In the past, staff of the Town of Chapel Hill has suggested the addition of an exclusive westbound left turn lane at the intersection of Country Club Road at Raleigh Street. Due to the complexity and constraints of this improvement (impacts on existing stone walls, adjacent property, and trees) it was determined that the assessment of these options be postponed.
- The intersection of Columbia Street at Manning Drive is to operate at LOS F during the PM peak hour in the No-Build (2024) scenario.
- The intersection of Columbia Street at Fordham Boulevard (northern ramp) is projected to operate at LOS E during the PM peak hour in the No-Build (2024) scenario.
- The intersection of Manning Drive at Fordham Boulevard is projected to operate at LOS F during the PM peak hour in the No-Build (2024) scenario.
The intersection of South Columbia Street at Cameron Avenue currently operates at acceptable level of service during both peak hours and is projected to operate at acceptable level of service during the No-Build (2024) scenario; however, this intersection but is expected to operate at LOS E during the AM peak hour and at LOS F during the PM peak hour in the Build (2024) scenario. The degradation to unacceptable levels of service is a result of the combination of the background traffic growth between 2017 and 2024 and the trips that are added due to the parking facilities that are included in the development plan but are not yet built.
The intersection of Columbia Street at Purefoy Road currently operates at acceptable level of service during both peak hours and is projected to operate at acceptable level of service during the No-Build (2024) scenario; however, this intersection is expected to operate at LOS E during the PM peak hour in the Build (2024) scenario. The degradation to unacceptable level of service is a result of the combination of the background traffic growth between 2017 and 2024 and the trips that are added due to the parking facilities that are included in the development plan but are not yet built.
The intersection of NC 54 at Barbee Chapel Road (East) currently operates at acceptable level of service during both peak hours and is projected to operate at acceptable level of service during the No-Build (2024) scenario; however, this intersection is expected to operate at LOS E during the AM peak hour in the Build (2024) scenario. The degradation to unacceptable level of service is a result of the combination of the background traffic growth between 2017 and 2024 and the trips that are added due to the parking facilities that are included in the development plan but are not yet built.
| ID # | Intersection | Control | Existing (2017) | No-Build (2024) | Build (2024) | |||
|---|---|---|---|---|---|---|---|---|
| AM | PM | AM | PM | AM | PM | |||
| 1 | Columbia Street/Rosemary Street | Signalized | C (WB-D) | E (NB-F) | C (WB-D) | C (WB-E) | C (WB-D) | C (WB-E) |
| 2 | Columbia Street/Franklin Street | Signalized | C (SB-D) | E (EB-E) | C (SB-D) | D (NB-E) | C (EB-D) | D (NB-E) |
| 3 | Franklin Street/Raleigh Street | Signalized | B (NB-D) | B (NB-C) | C (NB-F) | C (NB-D) | C (NB-F) | C (NB-C) |
| 4 | Merritt Mill Road/Cameron Avenue | Signalized | B (WB-D) | C (WB-C) | B (WB-D) | B (NB-C) | B (WB-D) | B (NB-C) |
| 5 | Cameron Avenue/Pittsboro Street | Signalized | B (EB-C) | B (EB-E) | B (EB-D) | C (EB-E) | B (EB-D) | C (EB-E) |
| 6 | Cameron Avenue/Columbia Street | Signalized | D (WB-E) | E (EB-F) | D (WB-E) | E (WB-F) | E (NB-F) | F (WB-F) |
| 7 | Cameron Avenue/Raleigh Street | Signalized | C (NB-E) | D (NB-E) | C (NB-D) | D (NB-E) | C (NB-D) | D (NB-F) |
| 8 | Pittsboro Street/McCauley Street | Signalized | B (WB-C) | B (WB-C) | B (WB-E) | D (WB-E) | B (WB-E) | D (WB-E) |
| 9 | Columbia Street/South Road | Signalized | B (EB-C) | C (EB-D) | C (EB-D) | D (EB-E) | C (EB-D) | D (EB-E) |
| 10 | Raleigh Street/South Road | Signalized | A (SB-C) | A (SB-B) | A (SB-C) | A (SB-D) | A (SB-C) | A (SB-C) |
| 11 | Country Club Road/South Road | Signalized | C (SB-D) | C (EB-D) | C (SB-D) | C (SB-D) | C (SB-D) | D (SB-D) |
| 12 | Columbia Street/Manning Drive | Signalized | C (EB-E) | C (EB-E) | C (EB-D) | F (WB-F) | C (EB-D) | F (WB-F) |
| 13 | Manning Drive/West Drive | Signalized | A (SB-D) | A (SB-B) | A (SB-D) | A (SB-C) | A (SB-D) | A (SB-C) |
| 14 | Manning Drive/East Drive | Signalized | B (NB-C) | C (NB-E) | B (NB-D) | C (NB-D) | B (NB-D) | C (NB-D) |
| 15 | Ridge Road/Manning Drive | Signalized | C (NB-D) | C (NB-D) | C (NB-D) | C (NB-D) | C (NB-D) | C (NB-D) |
| 16 | Mason Farm Road/Columbia Street | Signalized | B (EB-D) | C (EB-D) | B (EB-D) | C (WB-D) | C (EB-D) | C (WB-D) |
| 17 | Mason Farm Road/West Drive | Signalized | A (SB-C) | A (SB-C) | A (SB-D) | A (SB-C) | A (SB-C) | A (SB-C) |
| 18 | Mason Farm Road/East Drive | Signalized | B (NB-B) | A (EB-A) | C (NB-D) | A (NB-C) | C (NB-E) | A (NB-C) |
| 19 | Mason Farm Road/Purefoy Road | Unsignalized | A (EB-A) | A (SB-A) | A (EB-A) | B (SB-B) | A (EB-A) | B (SB-B) |
| 20 | Manning Drive/Skipper Bowles Drive | Unsignalized | A (NB-B) | A (NB-C) | A (NB-B) | A (NB-C) | A (NB-B) | A (NB-D) |
| 21 | Columbia Street/Purefoy Road | Unsignalized | A (WB-E) | B (WB-F) | A (WB-E) | C (WB-F) | A (WB-F) | E (WB-F) |
| 22 | Columbia Street/Fordham Boulevard (northern ramp) | Signalized | C (WB-E) | D (WB-E) | C (WB-E) | E (WB-E) | C (WB-E) | E (WB-E) |
| 23 | Columbia Street/Fordham Boulevard (southern ramp) | Signalized | C (EB-E) | B (EB-E) | C (EB-D) | B (EB-E) | C (EB-D) | B (EB-E) |
| 24 | Mason Farm Road/Fordham Boulevard | Unsignalized | A (SB-C) | C (SB-F) | A (SB-C) | C (SB-F) | A (SB-C) | D (SB-F) |
| 25 | Manning Drive/Fordham Boulevard | Signalized | C (SB-E) | E (SB-F) | D (SB-E) | F (WB-F) | D (SB-E) | F (WB-F) |
| 26 | Mason Farm Road/Oteys Road | Unsignalized | A (NB-A) | A (EB-A) | A (NB-A) | A (EB-A) | A (NB-A) | A (EB-A) |
| 27 | Franklin Street/Boundary Street | Signalized | A (SB-C) | A (SB-C) | A (SB-E) | C (SB-F) | A (SB-E) | C (SB-F) |
| 28 | Franklin Street/Park Place | Unsignalized | A (NB-A) | A (NB-B) | A (NB-A) | A (NB-B) | A (NB-B) | A (NB-B) |
| 29 | Battle Lane/Boundary Street | Unsignalized | A (WB-A) | A (NB-B) | A (WB-A) | B (NB-B) | A (WB-A) | B (NB-B) |
| 30 | Country Club Road/Battle Lane | Unsignalized | A (SB-C) | A (SB-E) | A (SB-D) | A (SB-F) | A (SB-D) | C (SB-F) |
| 307 | Country Club Road & Boundary Street | Unsignalized | A (SB-B) | A (SB-B) | A (SB-B) | A (SB-B) | A (SB-B) | A (SB-C) |
| 31 | Country Club Road/Gimghoul Road | Signalized | A (WB-C) | A (EB-B) | A (WB-D) | A (EB-D) | A (WB-D) | A (EB-D) |
| 32 | Manning Drive/Hibbard Drive | Signalized | A (SB-D) | B (SB-E) | A (SB-D) | A (SB-D) | A (SB-D) | A (SB-D) |
| 33 | Manning Drive/Craige Drive | Signalized | A (SB-D) | B (SB-F) | A (SB-D) | B (SB-E) | A (SB-D) | B (SB-D) |
| 34 | East Drive/Jackson Circle/Dogwood Deck Entrance | Unsignalized | A (WB-B) | A (WB-B) | A (WB-B) | A (WB-B) | A (WB-B) | A (WB-C) |
| 35 | East Drive/Dogwood Deck Exit | Unsignalized | A (EB-B) | A (EB-B) | A (EB-B) | A (EB-B) | A (EB-B) | A (EB-B) |
| 36 | Mason Farm Road/Hibbard Drive | Unsignalized | A (EB-B) | A (WB-C) | A (EB-B) | A (WB-C) | A (EB-C) | A (WB-C) |
| 37 | South Road/Bell Tower Drive | Signalized | A (NB-C) | C (NB-C) | A (NB-D) | C (NB-D) | A (NB-D) | C (NB-D) |
| 38 | Manning Drive/Old East Drive | Signalized | B (SB-D) | A (SB-C) | B (SB-D) | A (SB-D) | B (SB-D) | B (SB-D) |
| 39 | Manning Drive/Craige Deck | Unsignalized | A (NB-C) | A (NB-D) | A (NB-D) | A (NB-E) | A (NB-D) | B (NB-F) |
| 101 | US 15-501/Estes Drive | Signalized | C (WB-D) | C (WB-E) | C (WB-D) | C (WB-E) | C (WB-D) | D (WB-E) |
| 102 | US 15-501/Willow Drive | Signalized | B (WB-E) | C (EB-E) | B (WB-E) | C (EB-E) | B (WB-E) | C (EB-F) |
| 103 | US 15-501/Elliottt Road | Signalized | A (EB-E) | C (EB-E) | A (EB-D) | B (EB-E) | A (EB-E) | B (EB-E) |
| 104 | US 15-501/Ephesus Church Road | Signalized | C (WB-F) | D (EB-F) | C (WB-F) | D (EB-F) | C (WB-F) | D (EB-F) |
| 105 | US 15-501/Erwin Road | Signalized | A (WB-A) | A (WB-A) | A (WB-A) | A (WB-A) | A (WB-A) | A (WB-A) |
| 106 | US 15-501/Europa Drive | Signalized | A (NB-E) | A (NB-E) | A (NB-F) | A (NB-F) | A (NB-F) | A (NB-F) |
| 107 | US 15-501/Superstreet NB U-Turn | Signalized | C (NB-E) | C (NB-E) | B (NB-E) | B (NB-E) | B (NB-E) | B (NB-E) |
| 108 | US 15-501/Superstreet SB U-Turn | Signalized | A (SB-E) | B (SB-E) | A (SB-C) | B (SB-E) | A (SB-D) | C (SB-E) |
| 109 | US 15-501/Sage Road | Signalized | E (NB-F) | D (NB-F) | E (NB-E) | D (NB-F) | E (WB-F) | D (NB-F) |
| 110 | US 15-501/Eastowne Drive/BCBS | Signalized | C (SB-E) | B (SB-E) | B (SB-E) | B (SB-D) | B (SB-E) | B (SB-D) |
| 111 | US 15-501/Eastowne Drive/Lakeview Drive | Signalized | C (SB-F) | C (SB-F) | C (SB-F) | D (SB-F) | C (SB-F) | D (SB-F) |
| 201 | NC 54/Hamilton Street | Signalized | B (NB-E) | B (NB-E) | B (NB-E) | B (SB-E) | B (NB-E) | B (NB-E) |
| 202 | NC 54/Burning Tree Lane | Signalized | B (SB-E) | B (NB-E) | A (SB-E) | B (NB-D) | A (SB-E) | B (NB-D) |
| 203 | NC 54/Barbee Chapel Road Ext | Signalized | A (NB-E) | B (NB-F) | A (NB-E) | B (NB-F) | A (NB-E) | B (NB-F) |
| 204 | NC 54/Meadowmont Lane | Signalized | C (NB-D) | C (NB-D) | C (NB-D) | C (NB-E) | C (NB-D) | C (NB-E) |
| 205 | NC 54/Barbee Chapel Road (East) | Signalized | D (NB-F) | C (SB-F) | D (NB-F) | C (SB-F) | E (NB-F) | C (SB-F) |
| 301 | US 15-501/Culbreth Road/Mt Carmel Church Road | Signalized | C (EB-E) | C (EB-D) | D (EB-E) | C (EB-E) | D (EB-E) | D (NB-E) |
| 302 | US 15-501/Bennett Road/Arlen Park Drive | Signalized | B (EB-E) | B (EB-E) | B (EB-E) | B (EB-E) | B (EB-E) | B (EB-E) |
| 303 | US 15-501/Market Street | Signalized | B (EB-C) | B (EB-C) | B (EB-D) | C (EB-E) | B (EB-D) | C (EB-E) |
| 305 | Park Place & Boundary Street | Unsignalized | A (WB-A) | A (WB-B) | A (WB-A) | A (WB-B) | A (WB-B) | A (WB-B) |
Source: Table 4-11 of Development Plan TIA, December 2017